Where did 3 sets of 10 reps come from?

Where did 3 sets of 10 reps come from?
![]()

Is doing 3 sets of 10 repetitions wrong? Why or why not? Do you understand why that parameter started in the first place? As clinicians we should understand the physiological principles behind what we do. We should not just do what your professor, clinical instructor, or colleague tells you to do without understanding the WHY. So let’s explore!
Effective rehabilitation requires appropriate dosing of therapeutic exercise. Dosing is traditionally based on 1-repetition maximum (1-RM) lifting. Achieving therapeutic goals is related to using the appropriate percentage of a given 1-RM. A Soviet sports scientist named A.S. Prilepin developed the Prilepin’s Chart to facilitate the optimal relationship between percentage of 1-RM and the number of repetitions and sets one should perform. Column 2 has the percentage of the 1-RM weight to be lifted. Column 3 is the number of repetitions performed in each set at the given percentage of 1-RM. Column 4 represents the optimal total repetitions recommended at the given 1-RM. Finally, column 5 is the range of total repetitions that may be performed for a given percentage of 1-RM.
| Objective | Percentage 1-RM | Reps per Set | Optimal Total Reps |
Total Rep Range |
| Muscle Endurance | 55-65 | 6-10 | 24 |
18-30 |
|
Hypertrophy |
70-80 | 3-6 | 18 |
12-24 |
| Strength/Power | 80-90 | 2-4 | 15 |
10-20 |
| Strength/Power | 90+ | 1-2 | 4 |
2-10 |
Three sets of ten repetitions could make sense IF your goal is strength acquisition AND you assessed the person’s 1-RM. In the case of rehabilitating an injury, assessing 1-RM might put the individual at risk of further injury/re-injury. In that case, an extrapolated 1-RM could be the safer way to go. There are several formulas to help you extrapolate a 1-RM.
Let’s demonstrate a dosage for a squat. The individual can perform a 1-RM with 200 pounds. If the elected exercise percentage is 70%, 3-6 repetitions should be performed. If 4 repetitions can be achieved before “form-fatigue” occurs, then 4-5 sets should be completed to achieve 16-20 total repetitions. This is within the recommended total range (12-24) and close to the optimal total repetitions (18). The same calculations can be performed for 60% 1-RM or 80% 1-RM.
As simple as this calculation can be, there is an inherent problem. We need to know the 1-RM to perform these calculations. If an individual’s condition does not permit them to safely perform a 1-RM, what can you do? Fortunately, there are 7 prediction equations to extrapolate a 1-RM. These equations use the weight lifted and the number of repetitions to determine the 1-RM. Below are the 7 equations to calculate a 1-RM.
Researcher |
Formula |
| Brzycki (1993) | Weight ÷ [1.0278 – ( 0.0278 × Number of repetitions)] |
| Epley (1985) | Weight ÷ [1 + (0.0333 x reps)] |
| Lander (1985) | (100 × Weight) ÷ [101.3 – (2.67123 × Number of repetitions )] |
| Lombardi (1989) | (Weight x Number of repetitions)0.1 |
| Mayhew, Ball, Arnold, & Bowen (1992) | 100 x weight ÷ 52.2 + 41.9e-0.055 repetitions |
| O’Connor, Simmons, & O´Shea (1989) | Weight x [1 +(repetitions/40)] |
| Wathen (1994) | 100 x weight ÷ 48.80 + 53.8e-0.075 repetitions |
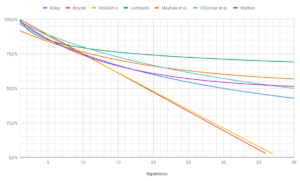
LeSuer et al (1997) performed a study to determine the accuracy of the 7 equations in the predicting of a 1-RM. The study included 67 participants who performed a bench test, squat, and deadlift. All correlation coefficients were high (r > 0.95) but the accuracy of prediction equations varied over different resistance exercises. The Mayhew, Ball, Arnold et al. (1992), Epley (1985), and Wathen (1994) formulas evidenced the lowest average error and highest relative accuracy over the resistance exercises examined. However, average error was high for all formulas over all exercises. The graph below displays the relationship.
There have several issues identified that could account for the variability in 1-RM testing. Different exercises, trained vs untrained, and endurance vs strength trained to name a few. However, given a lack of options when a 1-RM cannot be tested directly, Richen and Cleather (2014) suggested that traditional guidelines may underestimate the potential number of repetitions that can be completed at a given percentage of 1-RM but it is a place to start.
Dankel et al (2016) provided another option that correlates repetitions to the percentages of a 1RM. The simple chart below makes one very important assumption…..the repetitions need to be completed with proper form:
- 1-rep max – 100%
- 2-rep max – 97%
- 3-rep max – 94%
- 4-rep max – 92%
- 5-rep max – 89%
- 6-rep max – 86%
- 7-rep max – 83%
- 8-rep max – 81%
- 9-rep max – 78%
- 10-rep max – 75%
- 11-rep max – 73%
- 12-rep max – 71%
- 13-rep max – 70%
- 14-rep max – 68%
- 15-rep max – 67%
- 16-rep max – 65%
- 17-rep max – 64%
- 18-rep max – 63%
- 19-rep max – 61%
- 20-rep max – 60%
- 21-rep max – 59%
- 22-rep max – 58%
- 23-rep max – 57%
- 24-rep max – 56%
- 25-rep max – 55%
- 26-rep max – 54%
- 27-rep max – 53%
- 28-rep max – 52%
- 29-rep max – 51%
- 30-rep max – 50%
Nonetheless, please note, these are NOT the only strategies for dosage in an exercise program. Oxford, DeLorme, and DAPRE methods are other examples of resistance and repetition programs that vary the weight of each set. Exercise prescription is a science! This blog is just one attempt to simplify the process yet still implement sound physiologic principles.
NEXT question is about REST. How much time should be provided between exercise sets? Once again, it depends on the goal. For endurance, minimal rest is recommended to tax the fueling systems. To the contrary, for strength acquisition, 3-4x the work time allows for fuel replacement to ensure the ability to complete the next set with maximal muscle activation all the way through to the last repetition. So, if one takes 15 seconds to perform a given exercise set and the goal is strengthening, one should allow 45-60 seconds between sets.
Finally, what about PROGRESSION? One should not exercise with the same weights and repetitions all the time. Whatever resistance-repetition combination is selected, it should always be adjusted as the status/ability of the individual changes. For example, when the person can easily complete all the reps of the sets with good form, something needs to change! If the goal is endurance, one can choose to either increase the repetitions or decrease the rest time. If the goal is strengthening, the weight should be increased. Then as many repetitions as possible should be completed with good form. The repetitions should continue to be progressed until the target is achieved. Then resistance should be increased again and repetitions decreased and worked up. Thus, the pattern is increase weights/decrease reps, progress reps, increase weights/decrease reps, progress reps, etc – this pattern mimics the ups and downs of a see-saw.
In summary, the formulas provided simply offer you options to extrapolate 1-RM when the actual measurement is not possible or perceived to be potentially unsafe. Addressing rest and progression can further enhance the outcomes of the exercise program.
For more information about evidence-based orthopedic clinical tests or manual techniques please subscribe to iOrtho+ PREMIUM app at: https://iortho.xyz/
If you would like to learn more about the Mobil–Aider orthopedic measurement device to quantify joint mobility, please visit: https://mobil-aider.com/
- Dankel SJ, Mattocks KT, Jessee MB, et al. Frequency: The Overlooked Resistance Training Variable for Inducing Muscle Hypertophy? Sports Medicine. 2016
- LeSuer, Dale A.; McCormick, James H.; Mayhew, Jerry L.; Wasserstein, Ronald L.; Arnold, Michael D. “The Accuracy of Prediction Equations for Estimating 1-RM Performance in the Bench Press, Squat, and Deadlift”. Journal of Strength and Conditioning Research. 1997;11 (4): 211–213.
- Richens B, Cleather DJ. The relationship between the number of repetitions performed at given intensities is different in endurance and strength trained athletes. Biol. Sport 2014;31:157-161
- Wood TM, Maddalozzo GF, Harter RA. Accuracy of seven equations for predicting 1-RM performance of apparently healthy, sedentary older adults. Measure of Physical Education and Exercise Science. 2009; 67-94